By Lewis Perdue
The recent population study of adults in China that found no cardio-protective benefits of moderate alcohol consumption should be re-examined in the context of methodological and confounding factors not addressed in the published paper.
Published in early April by The Lancet, the study provoked sensational headlines among the general media proclaiming the definitive death of the “myth that moderate drinking can be healthy.”
The new study — by a unit of Oxford University — is remarkable for its parallel use of two different methods — conventional epidemiology and Mendelian Randomization (MR) — to re-analyze data from a large Chinese population study conducted from 2004-2008.
The Oxford study’s conventional epidemiology method found a familiar “J-shaped” curve found in some previous studies. By contrast, the MR method found no increased risk or benefit from myocardial infarction but increased risks of stroke — both hemorrhagic and ischemic.
Accordingly, the study concluded that, “Genetic epidemiology shows that the apparently protective effects of moderate alcohol intake against stroke are largely non-causal. ”
However, a close examination of the study, its supplemental materials and other data indicate methodological concerns including:
- Flaws in the study’s instrumental variable: The choice of the gene variants violate the exclusion principal — a primary requirement for a valid MR
- An invalid comparison between the results found between men and women
- Failure to account for vast differences in tobacco smoking between men and women
- Failure to correct for self-reporting/under-reporting errors in alcohol consumption when creating genotype-calculated categories for MR statistical analysis.
- An over-stated extrapolation of results to all alcoholic beverages despite evidence that spirits was the overwhelming beverage of choice
- Failure to control for contaminants found in Asian spirits
- Defined “moderate drinking” as 100 grams of alcohol or less, yet emphasized the relative risks at an overstated median level of 280 grams per week which is substantially above moderate.
In addition, the study suffers from a widespread lack of needed citations/footnotes on a number of key assertions. The study text fails to consistently draw a clear distinction from pre-existing Biobank methods and data and those developed and used by investigators in the present study.
It is necessary to note that MR provides an inference to causality, but that does not confirm direct causation. However, the new MR study outcomes do merit consideration as additional data points among many other studies in this field. Its conclusions fall within the same range of relative risk assessments as previous conventional epidemiological studies as illustrated in this annotated chart from a review article published in the British Medical Journal.
Mendelian Randomization: A Statistical Tool to Estimate Causation
Mendelian Randomization (MR) is a relatively new (1991) genotyping approach designed to bring an estimate of causation by statistically simulating Randomized Controlled Trials — (RCT).
(This link has a description of MR, RCTs and associated issues. It was written with non-scientists in mind, but also contains links to scientific journals for those more technically inclined.)
Conventional epidemiology, by contrast was developed in the mid-1800s, but continues to be plagued by multiple confounding factors — many of which cannot be known. As a result, conventional epidemiology is limited to finding statistical associations and correlations between an observed effect and its cause.
But correlation is not proof of causation. Just because a sports fan’s personal observation indicates that their favorite team seems to win whenever they wear a favorite t-shirt is a perceived correlation, but is clearly not causation.
Among the confounding factors in observational studies are: self-reported survey data, diet and exercise, differing types and alcohol levels of drinks, tobacco use, obesity levels, undiagnosed illnesses such as insulin resistance and obesity, genetic differences, lifestyles, memory recall issues and lack of awareness of how much alcohol is in drinks consumed, under-reporting due to embarrassment issues or reluctance to be truthful to authority figures that result in under-reporting of consumption by 30 to 50%.
The study
To select study subjects, Millwood et al. relied on data from the China Kadoorie Biobank which previously studied 512,715 adults from 10 geographic regions of China over the period of June 25, 2004, to July 15, 2008. The Biobank effort is now being conducted jointly by University of Oxford’s Clinical Trial Service Unit & Epidemiological Studies Unit (CTSU) and the Chinese Academy of Medical Sciences (CAMS)
The Biobank’s initial 2004 effort was a mostly self-reported, conventional epidemiological study of “chronic diseases of middle age, such as stroke, ischaemic heart disease (IHD), diabetes, cancer and chronic obstructive pulmonary disease (COPD).”
According to the Biobank web site, participants were recruited from the general population and were chosen according to “local disease patterns, exposure to certain risk factors, population stability, quality of death and disease registries, local commitment and capacity.”
According to Millwood et al., “All permanent residents (aged 35–74 years) without known major disabilities were to be invited into the [Biobank] baseline survey, and 499,500 (28% of 1,801,167 invitees) participated, along with 13,215 who were just outside the target age range.”
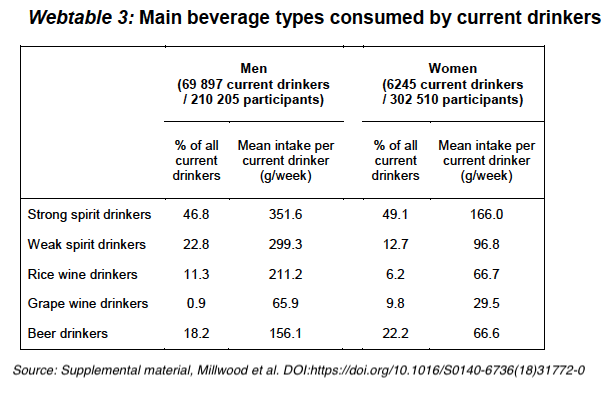
According to the Biobank data: 33% (69,897/210,205) of men reported drinking alcohol in most weeks, mainly as spirits, compared with only 2% (6245/302,510) of women.
Neither the Millwood study nor Biobank noted the invitation method nor what the total population was in the 10 selected areas.
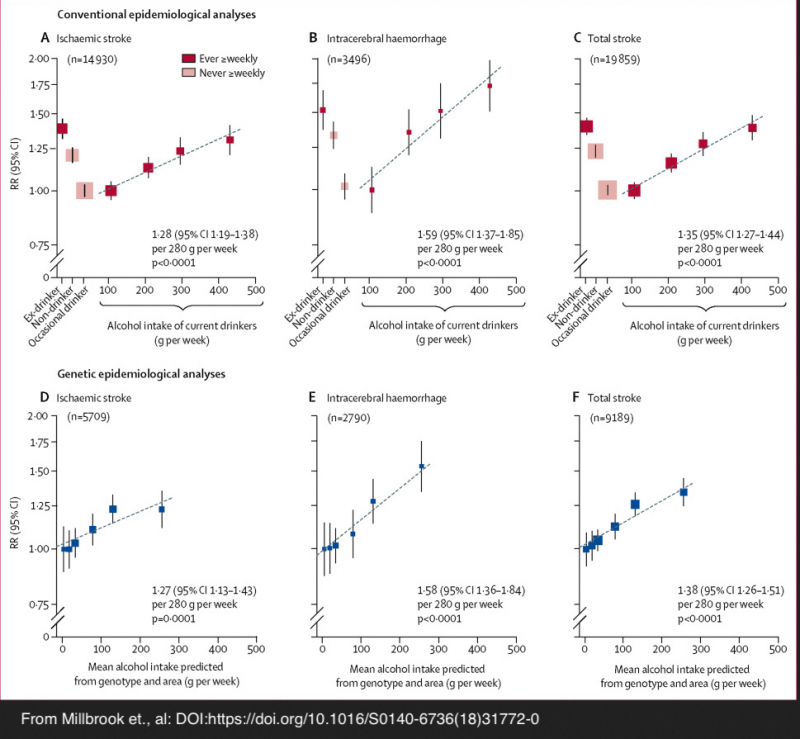
Results from conventional epidemiology
Millwood et al. relied on data from the entire Biobank cohort for the conventional epidemiological arm of the study. According to the study:
Among men, conventional epidemiology showed that self-reported alcohol intake had U-shaped associations with the incidence of:
- Ischaemic stroke (n=14,930),
- Intracerebral haemorrhage (n=3,496), and
- Acute myocardial infarction (n=2,958)
“[M]en who reported drinking about 100 g of alcohol per week (one to two drinks per day) had lower risks of all three diseases than non-drinkers or heavier drinkers.”
Results from Mendelian Randomization (MR)
- Intracerebral haemorrhage (relative risk [RR] per 280 g per week 1·58, 95% CI 1·36–1·84, p<0·0001) than for
- Ischaemic stroke (1·27, 1·13–1·43, p=0·0001), and
- Myocardial infarction, however, genotype-predicted mean alcohol intake was not significantly associated with risk (RR per 280 g per week 0·96, 95% CI 0·78–1·18, p=0·69)
MR Population Selection
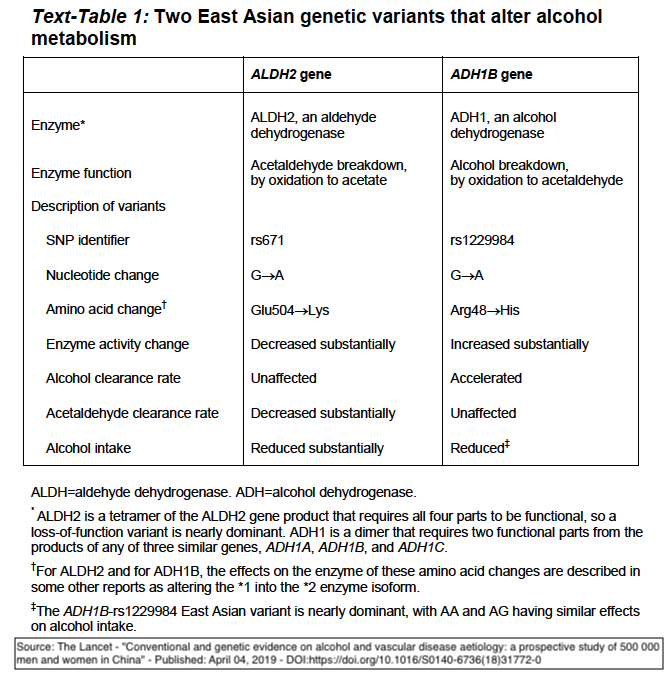
From the Biobank’s half-million study subjects in China, the Millwood investigators had 161,498 participants genotyped for two variants (polymorphisms) that alter alcohol metabolism.
Both polymorphisms directly affect a chemical — acetaldehyde — that are key in promoting what is known as the “Asian flush.” People with these polymorphisms experience unpleasant symptoms when they drink alcohol. Symptoms include reddening of skin on the face, neck and chest from dilation of blood vessels, rapid heartbeat, a drop in blood pressure, nausea, headaches, and trouble breathing.
Approximately 560 million people in the world, mostly of East Asian descent, experience an unpleasant reaction commonly called the “Asian Flush.”
“Flush” syndrome is most prominent in East Asians

Image from: https://www.gbhealthwatch.com/Trait-Asian-Flush.php
According to ALDH2 polymorphism and alcohol-related cancers in Asians: a public health perspective:
“The ALDH2*2 variant is essentially absent among the Europeans, but is highly prevalent among East Asians [22]. Large scale genotyping and haplotype analysis of the ALDH2 gene has traced the origin of the ALDH2*2 allele back to the ancient Pai-Yuei tribe about 2000–3000 years ago in Southeast China. The ALDH2*2 allele likely dispersed from its origin toward East Asia with the highest frequencies in Southeastern coastal regions of China (e.g. Guangdong, Fujian provinces) and countries with historical Han migrations, such as Taiwan, Japan, Korea and Singapore.
“The prevalence of the ALDH2*2 variant varies from 28% (e.g. in Korea) to as high as 45% (e.g. in Taiwan) in populations of these regions and an estimated 560 million East Asians are carriers of ALDH2*2 [25]. The ALDH2 deficiency is therefore one of the most common and genetically uniform enzymopathies in human carried by approximately 8% of the world population.”
The Millwood study stated that the investigators selected the two genetic polymorphisms as instrumental variables for their study because the acetaldehyde syndrome’s effects are so unpleasant that those who experience it are less likely to consume alcohol. In other words, the two polymorphisms directly decreased alcohol consumption.
Alcohol metabolism and two key polymorphisms

Image from https://www.gbhealthwatch.com/Trait-Asian-Flush.php
In humans, alcohol metabolism involves two types of enzymes: alcohol dehydrogenase (ADH) and aldehyde dehydrogenase (ALDH). When alcohol is consumed, the ADH converts it to acetaldehyde which is a potent toxic chemical carcinogen. However, ALDH quickly converts the acetaldehyde into acetate which the body can use for energy.
There are several ALDH genes that produce different enzymes found in various parts of the body, but the most important is ALDH2, which is found widely in body tissues and is especially abundant in the liver.
ALDH2 is responsible for more than 90% of acetaldehyde detoxification. A variation of ALDH2 — ALDH2-rs671 is affected by a Single Nucleotide Polymorphism (SNP) that drastically reduces enzyme effectiveness.
ALDH2-rs671 individuals whose genotype has two copies of the SNP (homozygous) have close to 0% effectiveness. The enzymatic efficiency of a heterozygous genotype ranges from 17-38%.
These extreme reductions in enzyme activity allow acetaldehyde to accumulate.
While the Millwood investigators noted that ALDH2-rs671 was the most important variant, the accumulation of acetaldehyde can aggravate in individuals who have an ADH1 gene polymorphism– ADH1B-rs1229984. This variant has an accelerated ability to convert alcohol to acetaldehyde, thus further increasing its accumulation in the presence of ALDH2-671’s diminished ability to convert it to acetate.
ALDH2-rs671 is also known as ALDH2*2
Randomization Through Simulation of Controlled Trials
Mendelian Randomization is an instrumental variable analysis designed to infer estimates of causation. These can be though of as statistically simulating a Random Controlled Trial (RCT).
RCTs have three main elements such as this example designed to test a new drug :
(1) Instrumental variable = Pharmaceutical ->
(2) Randomized experimental subjects ->
(3) Observed effect = Benefit/No Benefit
An RCT may also have different “arms” in which study subjects are randomly assigned to sub-cohorts which receive varying dosages of the tested drug.
Mendelian Randomization in the Millwood study employs an equivalent three steps and multiple arms.
(1) Instrumental variable = Genetic polymorphism ->
(2) Randomized experimental subjects ->
(3) Observed effect = decreased drinking resulting in a lower relative risk of 3 cardiovascular events
Methodology
The Millwood investigators employed multiple randomization procedures. First, they calculated the combinations of the possible genotypes of the test subjects: nine in all.
Then, because alcohol consumption varied widely across the 10 regions studied, the genotypes were used to calculate an estimate of mean male alcohol consumption for each of the nine possible genotypes.
This estimate resulted in 90 mean combinations of regions that were divided into six genotype-calculated alcohol intake categories estimated (in grams of alcohol/week): at 4, 18, 34, 78, 130, and 256. See chart/map, below from study.
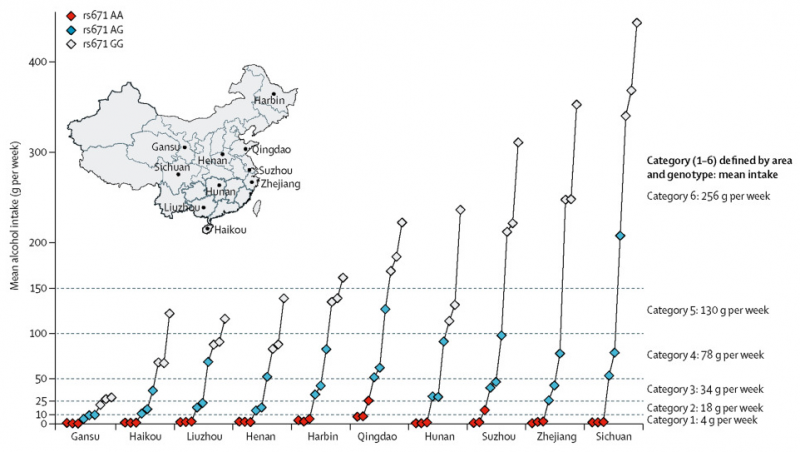
According to the published study, “Classification of individual participants into the six categories was dependent only on their genotype and study area, not on their individual drinking patterns.”
“Women were classified into the same six categories of genotype and area as men, regardless of their drinking patterns, to facilitate comparison between genotypic effects in men and in women.”
The study notes early on that: “We used these two variants to assess the relationships between cardiovascular risk and genotype-predicted mean alcohol intake in men, contrasting the findings in men with those in women (few of whom drink).”
Flawed Instrumental Variable
As noted in the selection of a suitable instrumental variable (IV) is of paramount importance in the design and conduct of a Mendelian Randomization study.
Among several requirements, a valid IV (in this case, genetic polymorphism) must:
- Have a robust indirect relationship with the observed outcome investigated. In this case, three cardiovascular events, and
- Cannot be directly connected with the observed effect/outcome. In other words, it cannot be associated with the outcome except via the exposure.
Accordingly, the choice of genetic polymorphisms ALDH2-rs671 and ADH1B-rs1229984 by Millwood et al. (Conventional and genetic evidence on alcohol and vascular disease aetiology: a prospective study of 500,000 men and women in China) are flawed because they are directly related to the observed effect: lower alcohol consumption mediated directly by the alcohol metabolite acetaldelyde.
As this 2014 article by Glymour in the British Medical Journal notes: “There is a further problem with this [ADH1B ] particular allele as a proxy for alcohol consumption. ADH1B polymorphisms influence alcohol metabolism, and therefore influence exposure to both alcohol and its metabolites. If these metabolites influence risk of cardiovascular disease, one of the core assumptions underlying mendelian randomisation is violated.”
Because acetaldehyde is an alcohol metabolite produced by instrumental variable ALDH2-rs671 and has direct effects on cardiovascular disease, the exclusion principal has been violated.
Among numerous examples of this direct action:
Zhong et al. (2018) found that ALDH2-rs671 directly affected Low Density Lipoprotein receptors via cellular mechanisms that increase atherosclerosis (“Acetaldehyde dehydrogenase 2 interactions with LDLR and AMPK regulate foam cell formation”). Significantly, Atherosclerosis is the leading determinant factor in the development ischemic stroke and myocardial infarction.
An article accompanying Zhong et al. (2018) in the same issue of the Journal of Clinical Investigation emphasized the conclusion that the discovery of the LDLR/AMPK pathway means that the relationship between ALDH2 S and atherosclerosis is “not just correlative”.
Ebert et al. (2014), “[E]stablished that ALDH2 controls cell survival decisions by modulating oxidative stress levels and that this regulatory circuitry was dysfunctional in the loss-of-function ALDH2*2 genotype, causing up-regulation of apoptosis in cardiomyocytes after ischemic insult.”
Aberle and Ren (2003), found that “… ALDH2 SNP [671] contributes to atherosclerosis directly impairs cardiac function and promotes lipid peroxidation resulting in oxidative damage.”
Acetaldehyde sources widespread in foods, beverages, tobacco and marijuana
Further complicating the use of these genetic polymorphisms as instrumental variables is the widespread presence of acetaldehyde in foods, beverages, and tobacco — both as additives and naturally occurring. The random assignment of people based on region may decrease the degree of confounding, but is unlikely to eliminate it especially because men and women do not always eat exactly the same foods.
Despite its notorious role as a potent carcinogen, acetaldehyde is also present in many non-alcoholic staples of human existence including:
- milk, yogurt, cheese and other dairy products,
- bananas, strawberries, apples, oranges and other fruit,
- vegetables ranging from carrots, garlic tomatoes, onion and peas,
Acetaldehyde is also found in
- High-fructose corn syrup,
- Beverages such as coffee, tea and soft drinks,
- Condiments such as chili-paste,
- As well as fermented and pickled vegetables and drinks such as kombucha and leaching from PET bottled mineral water bottles.
In addition, acetaldehyde is present in tobacco and marijuana smoke.
In the United States acetaldehyde is commonly added to many foods and beverages because the U.S. Food and Drug Administration considers it an ingredient that is “Generally Recognized As Safe (GRAS). (use CTRL+F to search the list at the link). Acetaldehyde is also a permitted food additive in China and a designated food additive in Japan.
Flawed assumptions in de facto “control” population
In addition to the flawed instrumental variable, the Millwood et. al. study noted frequently that their published analysis focused primarily on male subjects and that their analysis of women’s data was to serve as a proxy for a control group.
A close look at the data provided in the supplemental material raises significant doubts about this choice.
Emphasis added in the following direct quotes from the Millwood study.
“Genotypic analyses in women were done not to assess the effects of alcohol in women (since women’s alcohol intake was known to be minimal), but to determine the extent to which the genotypes studied in men had pleiotropic effects (ie, effects of the genotype that were not mediated by drinking patterns). Hence, we used the same six categories of genotype and area as in men, relating the area-adjusted genotypic effects in women to the mean male alcohol intake in these six categories.”
and
“Since few Chinese women drink, these genetic variants can be used to predict large absolute differences in mean alcohol intake in men, but not in women. Hence, if alcohol itself substantially affects the incidence of stroke or myocardial infarction then these two genetic variants should affect disease incidence differently in men and in women.”
Fact check needed on alcohol consumption data
“In our population men drink more than 20 times as much as women, so these two variants have large absolute effects on alcohol intake only among men. This permits reliable comparison of the causal effects of negligible, moderate, and higher levels of mean male alcohol intake.”
The statement that “men drink more than 20 times as much as women,” may need revisiting given the Millwood study’s statement that, “At baseline, 33% (69,897/210,205) of the men and 2% (6,245/302,510) of the women reported drinking some alcohol in most weeks, mainly as spirits….” That would be 16.5X as often. But that number also bears examining further in light of the Biobank data.
The number of current and occasional drinkers for men is 149,131 contrasted with 107,537 for women which indicates that the numbers are far from “rare” and closer than indicated.
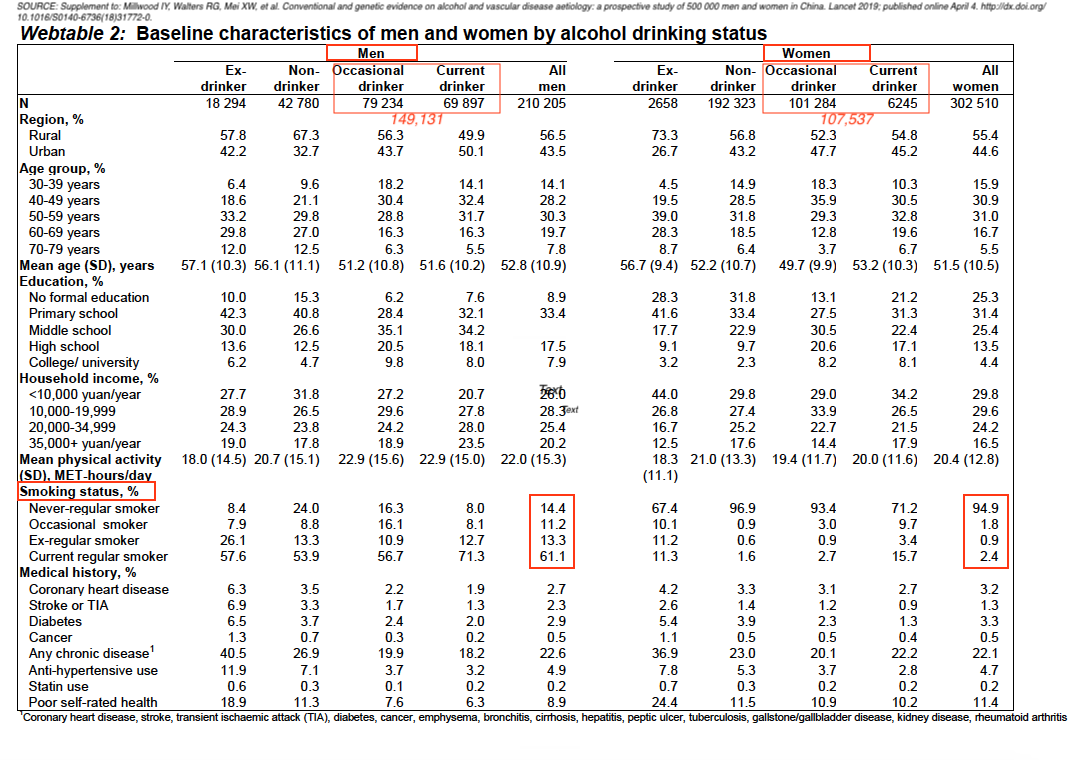
CAPTION: Annotated table, from Page 10, Supplement to: Millwood IY, Walters G, Mei XW, et al. Conventional and genetic evidence on alcohol and vascular disease aetiology: a prospective study of 500 000 men and women in China. Lancet 2019; published online April 4. http://dx.doi.org/10.1016/S0140-6736(18)31772-0.
WHO data indicate men drink only 2.6 times as much alcohol as women.
According to the World Health Organization, women drinkers in China consumed 5.2 liters of alcohol per capita and men drinkers consumed 13.7 liters. These data indicate that men drink 2.6 times as much alcohol as women.
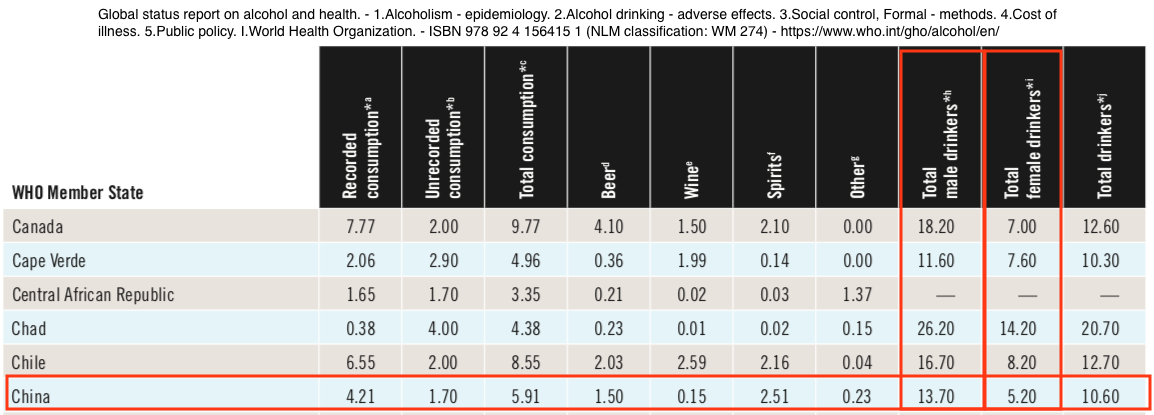
From: World Health Organization – Global Health Observatory (GHO) data (PDF) Report completed 2011 – Right-click table to view a larger image
In addition to problematic statements about alcohol consumption, using women as a de facto control population may be fraught with other concerns:
- Only 2.4% of women are current regular tobacco smokers as opposed to 61% of men.
- Women and men may exhibit different effects in the presence of acetaldehyde and alcohol.
Women, smoking and acetaldehyde
According to the World Health Organization tobacco smoking kills 7 million people per year and is the only product — when used as directed — kills half of its users. It is an important contributor to cardiovascular disease.
There are more than 4,800 chemical compounds in tobacco smoke, many of them carcinogens and contributors to cardiovascular disease. Acetaldehyde –the primary metabolite of alcohol — is a major constitutent of tobacco smoke. See also this link.
Significantly, the Millwood et al. study notes that it conducted separate MR trials for both men and women because it stated that women in China drink far less alcohol, which makes them suitable proxy control group.
The study mentions that, in calculating the six categories of genotyped drinking levels, “sensitivity analyses also adjusted them for education, income and smoking.”
However, that general statement regarding calculated drinking levels fails to address the very significant differences of tobacco smoking between men and women.
Alcohol & acetaldehyde – different effects in men and women
Further, women whose genotypes match those in the Millwood study react differently to alcohol.
This is illustrated by studies of diabetes which is, itself, a significant contributor to cardiovascular disease. One study of ALDH2 polymorphism and diabetes mellitus:
“female (but not male) workers with the ALDH2*1/1 genotype had significantly lower FPG [Fasting Plasma Glucose] levels than those with other genotypes, regardless of amounts of alcohol consumption
and
“LDH2 mutant genotypes (*1/2 and *2/2) are both independent risk factors for T2DM in female CAD patients. But there was no obvious correlation between the ALDH2 genetic polymorphism and T2DM in male patients.”
Other studies — Pang, et al. (2017), as well as Baraona et al. (2006) have also noted gender differences in the effects of alcohol.
While the gender differences have not been as well studied, the evidence available this far cast further doubt on the use of the women’s study as a credible proxy control population. Thus the comparisons of relative male/female relative risks are questionable.
Results most likely not applicable beyond spirits consumption
Millwood et al. note that most alcohol consumption is in the form of spirits, and in the study’s brief discussions of limitations stated: “Since participants reported drinking mainly spirits, the effects of other drinks (e.g., red wine) could not be assessed. Although many biomarkers were measured, they might not capture some important mechanisms by which alcohol could affect myocardial infarction risk. The two enzymes affected by the genetic variants we studied are involved in many biochemical pathways, so increases or decreases in their activity could have multiple physiological effects.”
 What’s more, the WHO (relying on Qian) estimates that approximately 40% of all alcohol consumed in China is unreported — produced and consumed without being recorded by the government. This casts further doubt on the genotype-calculated alcohol consumption catagories.
Formaldehyde and inherent acetaldehyde levels in Asian spirits may complicate health and genotypic interactions
Qian reports that: “Morbidity and mortality from poisoning with methanol and other contaminants [from illegally produced alcohol] are a major public health concern.”
In addition to possible bootleg production contaminants, Asian spirits contain the second highest levels of formaldehyde (and the highest over WHO limits) tested by Jendral et al. (2011).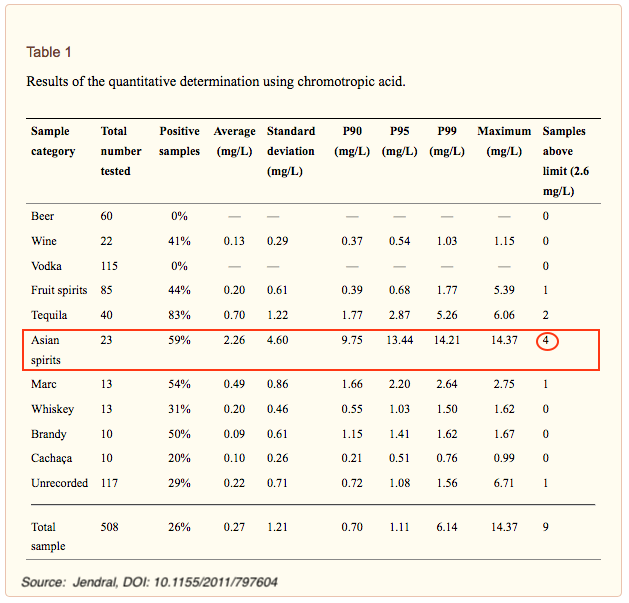
Lachenmeier et al. (2013) tested only registered Asian beverages approved for foreign export and found significant levels of both formaldehyde and acetaldehyde and noted that “the incidence of the aldehydes, especially of formaldehyde, in the Asian sample was considerably higher than what was found in surveys of European-style alcoholic beverages.”
In addition, Lachenmeier et al. (2013) found “In 9 of 39 samples (23%) analyzed for formaldehyde, its concentration was higher than the WHO IPCS tolerable concentration of 2.6 mg/L. ”
What’s more, study by found Newman et al, found that 40 of the 61 samples of bai jiu (a traditional Chinese spirit) had acetaldehyde concentrations above the 50 g/hl pa guideline set by the Alcohol Measures for Public Health Research Alliance (AMPHORA) of the European Commission.
It cannot be determined what impact (if any) the concentrations of formaldehyde and the addition of acetaldehyde in the drinks (in addition to the acetaldehyde produced by the metabolism) may have on drinker health effects and resulting impact on the Millwood et al. study.
Millwood et al., in its discussions of study limitations, noted that: “In women, however, there were no material genotypic associations with cardiovascular risk or physiological factors, with the exception of small effects on anthropometry and, perhaps, blood pressure. Hence, the genotypic findings in men were probably driven mainly by alcohol exposure rather than by pleiotropic effects.”
That remains a concern given conflicting conditions.
Not broadly applicable beyond East Asian genotypes
Millwood et al. reported that: “In populations of European descent, however, only the less important of these two variants (rs1229984) is found, so genetic studies cannot directly compare the effects of negligible and moderate alcohol intake levels.”
However, the geographic distributions vary much more broadly than in populations of European heritage.
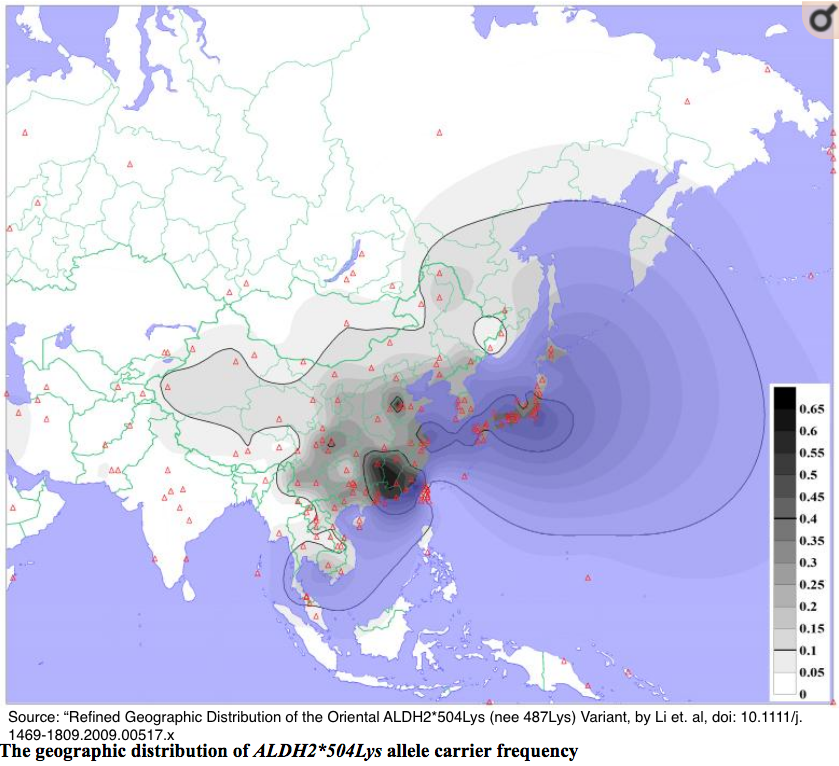
Zhong et al. (2018) presented a more thorough assessment. The following is a condensation of that paper, utilizing bullets to present their extensive review in a more intuitive form. All bullet points are footnoted in the original publication.
Among studied populations, ALDH2*2 polymorphism allele:
Is almost absent or not seen among:
- Americans
- Africans
- Europeans
- Australians
- West Asians (Turkish and Indian )
Is minor among Central and Southeast Asian populations
- 10.15% among Thai
- 1.55% among Uzbek
- 5.81% among Filipino
- 3.42% among Malaysian
Is major among East Asians:
- 17.90% among 648 Chinese
- 29.90% among Japanese
- 18.71% among Koreans
- 25.24% Mongolians individuals) .
- 28.13% among the Hakka ethnic group
For the intellectual curious
- A Literature Review by Eng et al. (2007) offers further detail and more granular data.
- This paper by Li et al. (2009) also offers an extensive and detailed ethnic distribution.
Under-reporting could affect genotype-calculated categories
Numerous sources indicate that self-reported alcohol consumption globally is usually under-reported by 30 to 40%. Significantly, risky drinkers are even more likely to underestimate their consumption.
In their brief discussion of study limitations, Millwood et al. state: “A major limitation of all alcohol epidemiology is that exposure is uncertain. Drinking patterns are variable, and intake may be substantially underperceived or under-reported. If mean intake was really substantially higher than reported, then all our conventional and genotypic dose-response relationships are too steep, and the real relationships are substantially shallower.”
Under-reporting would also affect the study’s genotype-calculated consumption categories.
As noted above, alcohol consumption varied widely across the 10 regions studied by Millwood et al., and as a result the genotypes were used to calculate an estimate of mean male alcohol consumption for each of the nine possible genotypes.
This estimate resulted in 90 mean combinations — 9 genotypes x 10 regions. These were then assigned into six genotype-calculated alcohol intake categories estimated (in grams of alcohol/week): at 4, 18, 34, 78, 130, and 256.
According to Webtable 3 (above) from the Millwood supplemental material, 69.6% of spirits drinkers consumed a mean intake of 30 to 35 drinks per week (at 10g ETOH/drink) — 4.28 to 5 drinks per day — substantially above moderate consumption and higher than the calculated genotype consumption categories.
That presents an opportunity for errors resulting from under-reporting. If so, then the categories of consumption that were created from the randomized data are significantly too low.
Note: The Millbrook et al. study did not specify the source of the regional consumption data used to create the categories. However, a previous paper by Millbrook — Alcohol consumption in 0.5 million people from 10 diverse regions of China: prevalence, patterns and socio-demographic and health-related correlates — was referenced in the supplemental material. That paper was based on the Biobank baseline surveys and offers the assumption (never a good practice in scientific studies) that the data for the current study, came from those same baseline surveys.
WHO consumption at odds with Millwood
Data from the World Health Organization (WHO) and published studies indicates that the self-reported baseline data from Biobank as well as the genotypically calculated consumption categories are dramatically lower than indicated.
According to the WHO, 55.6% of the men in China and and 15.0% of the women were current drinkers.
That is in contrast with the baseline Biobank data relied upon by Millwood et al., which concluded that 33% of the men and 2.1% of women were current drinkers.
Current drinkers
(WHO relying on Qian): Men: 55.6%, Women 15.0%
Millwood, relying on Biobank: Men: 33%, Women 2.1%
Further, the WHO (relying on Qian) estimates that approximately 40% of all alcohol consumed in China is unreported — produced and consumed without being recorded by the government.
This is also in line with numerous published studies estimate under-reporting of alcohol intake at 30 to 50%.
Recall and alcohol content issues
Recall issues and lack of alcohol content awareness are in play with self-reported alcohol consumption, especially when asked how many “drinks” a person consumes in a given time period. This is significant in light of the Biobank’s self-reported consumption data which is quantified in “drinks.”
Millwood et al. converted drinks to grams as “100 g of alcohol per week (one to two drinks per day): without specifying any standard for the conversion. The WHO and 37 countries specify that a standard drink size is 10 g pure ethanol, but variation was wide (8-20 g). Taking 10 grams as a drink size, 100 grams/week would be 10 standard drinks which, according to the U.S. NIAAA, the standard drink is 14 grams.
Social barriers may encourage under reporting.
Women, more than men, are subject to social pressure which may contribute to under-reporting. Qian reports that, “Even though drinkers were more accepting of other people’s drinking than abstainers …. [B]oth groups rated social drinking among females less acceptable than social drinking among males and drinking in an adult private context, such as with a spouse, partner, or cohabitant.”
Social pressures are especially problematic given that the process for gathering Biobank information was personally invasive and involved intensive data gathering in a face-to-face situation with a representative of the government.
According to the original Biobank study design, participants attended survey clinics where interviewers using laptop-based questionnaires completed an extensive, 18-page baseline questionnaire that included
- demographic and socio-economic factors,
- smoking,
- alcohol & tea drinking,
- diet,
- physical activity,
- pre-existing diseases and related medication,
- indoor air pollution now and in the past,
- reproductive history (women),
- sleeping and
- psychological status.
Physical measurements included:
- height, weight, hip and waist circumference,
- bio-impedance, lung function, carbon monoxide,
- blood pressure and pulse rate.
Blood spot tests were also done to determine random blood glucose and hepatitis B surface antigen (HBsAg).
Also included were address, phone, and National ID number needed for follow-up.
The original Biobank protocol collected non-fasting blood sample for long-term storage. While Millwood et al. did not specifically mention the source of the tissue used for genotyping.
Study self-selection bias
According to World Bank statistics, women constituted approximately 48.6 percent of the Chinese population during the time period when the China Kadoorie Biobank enrolled its participants. Millwood et al. noted that 512,715 adults had been enrolled and that 210,205 (41%) were men and 302,510 (59%) were women.
This indicates a self-selection bias of unknown causes.
While Millwood et al. went to great statistical lengths to randomize both the male and female cohorts in their study, the separate MR randomizations of each cohort could not eliminate the possible confounding issues of overall health differences between men and women.
Suggestions offered for further evaluation of instrumental variables in a manner that increases credibility
Glymour et al. (2012) notes that, “As with other instrumental variable (IV) analyses, Mendelian randomization (MR) studies rest on strong assumptions. These assumptions are not routinely systematically evaluated in MR applications, although such evaluation could add to the credibility of MR analyses. In this article, the authors present several methods that are useful for evaluating the validity of an MR study. “
Comments are closed.