By Lewis Perdue
NOTE: You may right-click all images to view a larger version
The recent Lancet study that found no cardio-protective benefits of moderate alcohol consumption is marred by substantial problems which raise serious concerns about the validity of its conclusions. Indeed, all studies done so far on the topic of alcohol consumption and health have been epidemiological. And while epidemiology can be valuable in spotting issues worth exploring farther, it is a process of correlation.
Correlation is not causation.
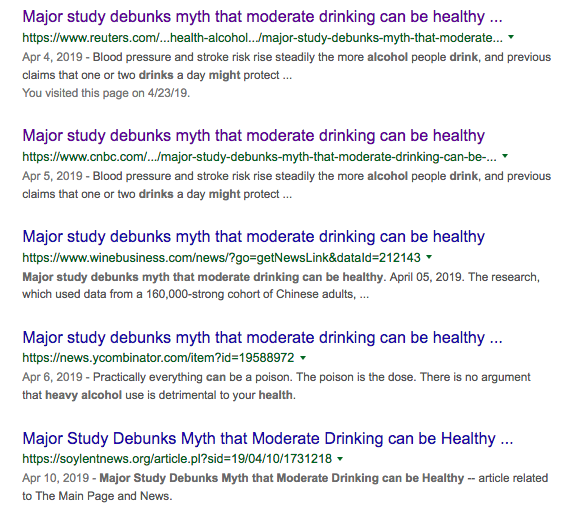
That article provoked sensational headlines among the general media proclaiming the definitive death of the “myth that moderate drinking can be healthy.”
This ad-free article is made possible by the financial support of the
Center for Research on Environmental Chemicals in Humans: a 501(c)(3) non-profit.
Please consider making a tax-deductible donation for continued biomedical research.
The study’s most serious flaw appears to be the choice of an inappropriate gene variation used for a relatively new statistical method called Mendelian Randomization (MR).
However, even if a proper gene variation had been selected, many other errors would still raise serious questions about its conclusions.
Other flaws include:
- An invalid comparison between the results found between men and women,
- Failure to account for vast differences in tobacco smoking between men and women when comparing health effects,
- The use of a comparison population whose drinking and tobacco-smoking consumption data are substantially at odds with data from the World Health Organization, The Chinese Government and other international data,
- Failure to correct for self-reporting/under-reporting errors in alcohol consumption when creating genotype-calculated categories for MR statistical analysis,
- An over-stated extrapolation of results to all alcoholic beverages despite evidence that spirits was the overwhelming beverage of choice,
- Failure to control for contaminants found in Asian spirits,
Conventional epidemiology
Understanding the attraction of Mendelian Randomization requires a quick glance at conventional epidemiology.
Moderate alcohol consumption studies done thus far have been done using conventional epidemiology which was first developed in 1854 when bodies suffered littered the streets of Soho, London during the country’s worst-ever cholera epidemic.
It was “as violent as it was sudden,” said a local anesthesiologist, Dr. John Snow.
”It was like the Great Plague all over again,” he wrote. Dr. Snow found links between the deaths and where people lived. Skeptical local officials repeatedly refused to believe the doctor because he had no proof. All his connections and associations were based on numerous observations he made and his efforts to connect them to cholera.
The epidemic grew worse. Snow observed that the epidemic was connected to the water supplies in a specific part of London.

While Dr. Snow could not immediately prove the water was the source, he continued to press the officials. Desperate and tired of being harangued by they did what the persistent physician suggested. The epidemic subsided.
The problem with links and associations
In 1854, Dr. Snow observed the situation and found links and associations: correlations. But correlation is not proof of causation. Just because you may observe that your favorite sports team wins whenever you wear your lucky socks is a correlation, but not causation.
However, correlations can be valid indications that something is afoot and needs to be further investigated. Many lives have been spared because links and correlations have led to discovering causations.
For example, Edward Jenner’s 1796 observations that milkmaids who had previously caught cowpox did not fall ill with smallpox led to a vaccine. More recently, the foundations of Dr Snow’s conventional epidemiology led to the discovery of HIV and resulting AIDS treatments.
Confounding factors in conventional epidemiology
Conventional epidemiological studies have always been plagued by multiple confounding factors — many of which cannot be known. This is because they are “observational” — just like Jenner and Dr. Stone’s original work.
People are different in many ways: genes, diet, exercise, personal hygiene, access to medical care, work and home environments, tobacco use, obesity levels, un-diagnosed illnesses such as insulin resistance and obesity, genetic differences, lifestyles and more.
The situation is even more complicated in studies of alcohol consumption which, like the Lancet study, rely mostly on self-reported observational survey data asking participants to describe their consumption of consumption of alcohol.
Confounding the problems further are differing types of alcohol, consumption patterns, memory recall issues, and lack of awareness of how much alcohol is in drinks consumed
Significantly, alcohol as a whole consumption is under-reported by 30 to 50% due to embarrassment issues or reluctance to be truthful to authority figures.
Statistical methods exist that attempt to correct for confounding factors, but those are never perfect, especially when some factors cannot be accurately known.
Clearly, observational studies of alcohol consumption and health that use conventional epidemiology establish links and correlations, but cannot be declared “causal.”
Mendelian Randomization tries to infer an estimate of causation from observational data.
Into this realm of links and unknown confounding factors steps Mendelian Randomization (MR).
The concept of MR is a relatively recent one dating from the mid-1980s and made possible by the development of gene sequencing. Most sources attribute the concept to Dutch scientist M.B. Katan while affiliated with Wageningen University & Research.
In a 1986 journal article —Apolipoprotein E isoforms, serum cholesterol, and cancer — Katan wrote that “A comparison of apo E phenotypes in cancer patients with those in matched controls might thus shed light on the relation between low cholesterol and cancer.” (A phenotype is an observable result of the specific protein expressed by a specific gene.)
Katan was not able to follow through on his novel idea because gene sequencing was not widely available then. Because of that, two Oxford University scientists, Richard Gray and Keith Whitley are credited with the first published paper using MR in 1991.
MR tries to move the conclusions closer to causation by emulating Randomized Controlled Trials (RCT). The RCT is considered the “Gold Standard” in scientific studies such as those required to assess the effectiveness of new pharmaceuticals.
What does a “Gold Standard” Randomized Control Trial (RCT) look like?
Consider the hypothetical situation where a new pharmaceutical to treat “polka dot syndrome” needs to be tested for effectiveness.
To conduct an RCT, test subjects with polka dot syndrome are recruited. Half are assigned randomly to an experimental group who receives the new treatment pill and the remaining half are assigned to a control group who receive a placebo pill, or simply no treatment at all.
Some RCT’s are “blind” which means that none of the test subjects know which group they are in. A “double blind” study means that neither the subjects or the investigators know.
The degree to whether the polka dots in the experimental group disappear (or fail to) is the outcome of the study.
Simply put, the flow diagram for the RCT above has three parts and looks like this:
- Causal action: pharmaceutical +
- Randomized experimental subjects =
- Observed effect/outcome: Cure/no cure
In many cases, RCTs have various “arms” which could correspond to trying out different dosages in a search for an optimum level. In all cases, study participants are assigned randomly to the arms.
Why can randomization increase accuracy?
Humans are randomized even before they are born. This is one of the central tenets of Mendelian inheritance — after which MR is named. If that seems confusing, this link may help.
Randomization in a controlled trial can promote accuracy in scientific studies because confounding factors become less significant when large numbers of people are randomly assigned to one group or another.
A large number of participants makes it more likely that variations among test subjects balances out individual confounding factors.
RCTs are obviously far more complicated than the hypothetical polka dot syndrome example, above. This link offers the curious a more in-depth look.
The more people in an Random Controlled Trial, the better
To do an RCT properly, requires many people. The more in the study, the better the likelihood that individual variations will be canceled out. Randomizing 14 people doesn’t work. Thousands work better. Hundreds of thousands better still.
Despite their crowning role at the top of the world of experiments, RCTs often struggle to understand why some subjects in the experimental group did not respond, responded partially, or perhaps developed unanticipated side effects.
Why no RCTs for alcohol and health?
RCTs tend to be expensive.
In addition, those involving human subjects, dangerous chemicals or other substances are unethical in many cases.
How does randomization infer causation in a MR study?
The key advantages of using gene variations in MR are (From The British Medical Journal):
- “Non-modifiable, and therefore not susceptible to ‘reverse causality’;
- “Should not be influenced by confounding, due to Mendel’s second law; and
- “Measured with precision, thereby reducing regression dilution bias due to random measurement error.”
A good overall starting point on getting a further handle on MR is this link from the British Medical Journal that is aimed at physicians: Mendelian Randomisation – for the moderately intelligent.
Genetic markers are key to MR
Mendelian Randomization strives to reduce confounding factors by using a genetic marker — a specific DNA sequence which can be positively identified with an observable characteristic. This genetic marker is also known as an Instrumental Variable (IV).
In the case of the Millwood study published in the Lancet, the researchers chose as its Instrumental Variables two genetic variations (known as polymorphisms) that cause many people of East Asian descent to suffer very unpleasant symptoms.
As we will see further along in this article, that choice seems to have been an unfortunate one.
Popularly known as the “Asian flush” people with these genetic polymorphisms experience unpleasant symptoms when they drink alcohol. Symptoms include reddening of skin on the face, neck and chest from dilation of blood vessels, rapid heartbeat, a drop in blood pressure, nausea, headaches, and trouble breathing.

Image from: https://www.gbhealthwatch.com/Trait-Asian-Flush.php
The Millwood investigators hypothesized that the polymorphisms carried by “Asian Flush” sufferers would cause them to consume less alcohol.
- Causal action (Instrumental Variable): Genetic variation +
- Randomized experimental subjects =
- Observed effect (decreased drinking) which could be correlated with risk of cardiovascular events
The Millwood study selected two genotype variations to use as Instrumental Variables: One affecting ALDH2 and one ADH. ALDH2 is the more important of the two because it is responsible for detoxifying more than 90% of acetaldehyde. The Millwood investigators confirmed that by finding few effects related to ADH.
The ALDH2 selected by the Millwood study as an Instrumental Variable has a change in one single nucleotide. But that one “letter” drastically reduces the ability to convert acetaldehyde to acetate. That causes acetaldehyde to accumulate, resulting in “Asian Flush.”
Alcohol metabolism and polymorphisms
In humans, alcohol metabolism involves two types of enzymes: alcohol dehydrogenase (ADH) and aldehyde dehydrogenase (ALDH).
When alcohol is consumed, the ADH converts it to acetaldehyde which is a potent toxic chemical carcinogen. However, ALDH quickly converts the acetaldehyde into acetate which the body can use for energy.

Image from https://www.gbhealthwatch.com/Trait-Asian-Flush.php
Polymorphism? Nucleotide? Genotype?
The word “genotype” refers to a specific series of nucleotides. Genotypes can refer to a single gene (ALDH) for example) or even to the entire genetic sequence of a human (or other organism).
A polymorphism exists when the DNA sequence of a gene varies from the “wild” version.
A wild version has a genetic sequence that is the most common in a specific population.
Variations are called polymorphisms.
Variations from the wild genotype are sometimes referred to as mutants. The various nucleotide forms of a gene are known as “alleles.”

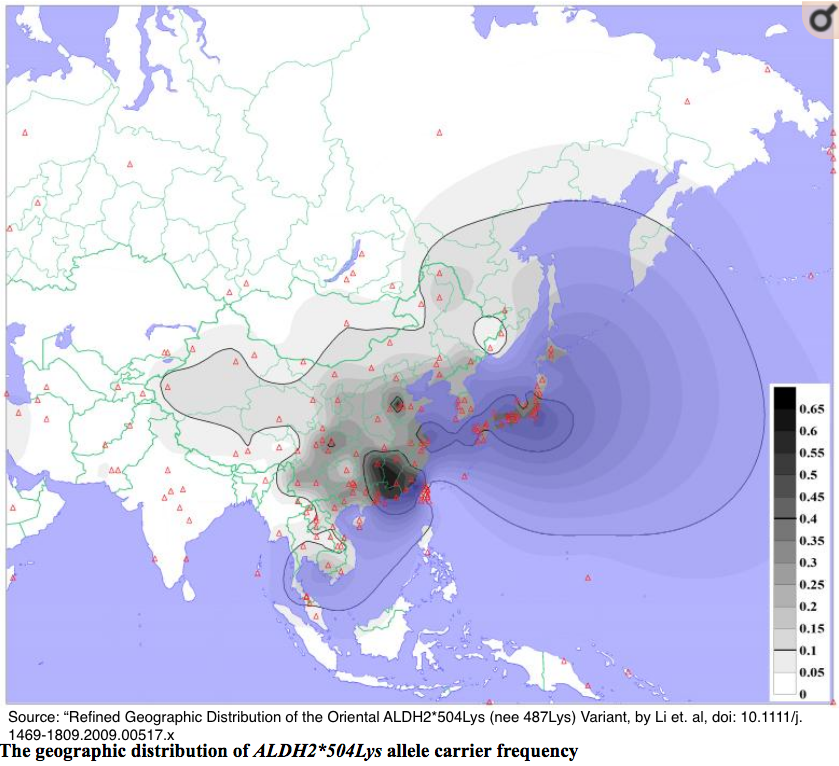
Approximately 560 million people in the world, mostly of East Asian descent, experience an unpleasant reaction commonly called the “Asian Flush.” Approximately 8% of the world’s population carries these variations.
Those polymorphisms are rare among Caucasians, Africans, and western Asian countries (India, Pakistan etc.)
Some Basic Rules of MR
There exists a set of rules that MR must follow in order to be valid.
This means that, in a study of the cardiovascular risks of alcohol the instrumental variable (polymorphism) selected:
(1) Must have a robust but indirect causal relationship with the observed outcome investigated. In this case, cardiovascular disease.
(2) Randomly assigns each study participant into groups (similar to an RCT) where those groups are free of any systematic confounding variables.
(3) It is not associated with the outcome except via the exposure.
In the Millwood study, the connection is between “Asian Flush” and alcohol consumption. But other data indicates that the connection was direct — and, if so, invalidates their selection.
The Millwood Randomizations
The Millwood investigators employed multiple randomization procedures. First, they calculated the combinations of the possible genotypes of the test subjects: nine in all.
Then, because alcohol consumption varied widely across the 10 regions studied, the genotypes were used to calculate an estimate of mean male alcohol consumption for each of the nine possible genotypes.
This estimate resulted in 90 regional that were divided into six alcohol intake categories that were calculated from the various genotypes.
Finally, all of the participants were randomly assigned to an alcohol consumption category regardless of the individual’s self-reported consumption estimates.
As data, presented below, will indicate, those consumption categories could be 30 to 40% lower than calculated due to under-reporting.
The paper did not offer details on the method of calculating the various categories.
The Study Details
According to the study, Millwood et al. relied on data from the China Kadoorie Biobank which previously studied 512,715 adults from 10 geographic regions of China over the period of June 25, 2004, to July 15, 2008. The Biobank effort is now being conducted jointly by University of Oxford’s Clinical Trial Service Unit & Epidemiological Studies Unit (CTSU) and the Chinese Academy of Medical Sciences (CAMS)
The Biobank’s initial 2004 effort was a mostly self-reported, conventional epidemiological study of “chronic diseases of middle age, such as stroke, ischaemic heart disease (IHD), diabetes, cancer and chronic obstructive pulmonary disease (COPD).”
From the Biobank’s half-million study subjects in China, the Millwood investigators had 161,498 participants genotyped for ALDH2B and ADH1B polymorphisms. The “B” indicates the presence of gene variations which reduce the gene-owner’s ability to metabolize alcohol.
Millwood study’s foundational error
The foundation of a Mendelian Randomization study is the selection of an inappropriate gene variation (polymorphism).
MR rules hold that a polymorphism serves as as the Instrumental Variable cannot have a direct effect on the observed effect.
Despite that, the Millwood investigator chose to study an ALDH2 polymorphism that has direct effects on cardiovascular consequences.
That violates the exclusion principal — a primary requirement for a valid MR.
As early as 2014, this article in the British Medical Journal pointed out that choosing the main gene variation in the Millwood study would violate the exclusion principal.
This is because the chosen Instrumental Variable polymorphism creates a metabolite chemical called acetaldehyde which has direct effects on cardiovascular disease.
This direct effect invalidates that polymorphism as the key Instrumental Variable used in the Millwood.
Direct cardiovascular effects of Millwood’s chosen Instrumental Variables
Among numerous examples of this direct action which appears to invalidate the Millwood study’s Instrumental Variable and its conclusions:
- Zhong et al. (2018) , ALDH2 variant increases atherosclerosis.
- An article accompanying Zhong et al. (2018):the relationship between ALDH2 and atherosclerosis is “not just correlative”.
- Ebert et al. (2014), “[E]stablished that ALDH2 controls cell survival decisions by modulating oxidative stress levels and that this regulatory circuitry was dysfunctional in the loss-of-function ALDH2*2 genotype [same as Millwood study], causing up-regulation of apoptosis [controlled cell death] in cardiomyocytes [heart cells] after ischemic insult.”
- Aberle and Ren (2003), found that ALDH2 variant contributes to atherosclerosis and “directly impairs cardiac function.”
Flawed assumptions in “control” population: Women studied only as a comparison group to men.
In addition to the flawed instrumental variable, the Millwood et al. study noted frequently and prominently that their published analysis focused primarily on male subjects.
They emphasized that their analysis of women’s data was only done as an outcome comparison to the men’s results.
A look at data sources from the World Health Organization, other Chinese studies and the World Bank indicate such vast discrepancies in consumption that the validity of the comparisons is in question.
Emphasis added in the following direct quotes from the Millwood study.
- “In our population men drink more than 20 times as much as women, so these two variants have large absolute effects on alcohol intake only among men. This permits reliable comparison of the causal effects of negligible, moderate, and higher levels of mean male alcohol intake.”
- “Genotypic analyses in women were done not to assess the effects of alcohol in women (since women’s alcohol intake was known to be minimal)and
- “Since few Chinese women drink, these genetic variants can be used to predict large absolute differences in mean alcohol intake in men, but not in women. Hence, if alcohol itself substantially affects the incidence of stroke or myocardial infarction then these two genetic variants should affect disease incidence differently in men and in women.”
Those consumption numbers and ratios cited do not agree with other sources.
The Biobank data indicate the ratio of men to women drinkers is closer to 3:1 which approximates the World Health Organization estimate which puts the ratio at 2.6:1
The number of current and occasional drinkers for men is 149,131 contrasted with 107,537 for women which indicates that the numbers are far from “rare” and closer to parity than indicated.
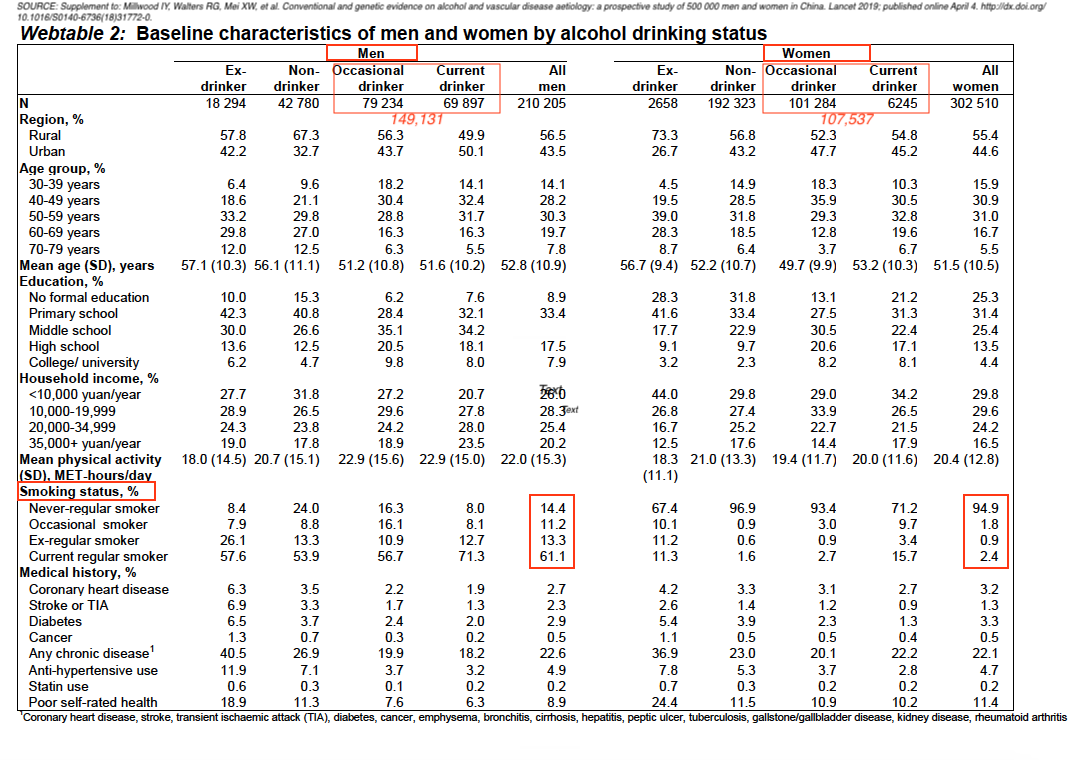
CAPTION: Annotated table, from Page 10, Supplement to: Millwood IY, Walters G, Mei XW, et al. Conventional and genetic evidence on alcohol and vascular disease aetiology: a prospective study of 500 000 men and women in China. Lancet 2019; published online April 4. http://dx.doi.org/10.1016/S0140-6736(18)31772-0.
WHO data indicate men drink only 2.6 times as much alcohol as women.
According to the WHO, 55.6% of the men in China and and 15.0% of the women were current drinkers.
That is in contrast with the baseline Biobank data relied upon by Millwood et al., which concluded that 33% of the men and 2.1% of women were current drinkers.
In addition WHO data (below) indicate that women drinkers in China consumed 5.2 liters of alcohol per capita and men drinkers consumed 13.7 liters. These data indicate that men drink 2.6 times as much alcohol as women. This also falls far short of Millwood’s characterizations.
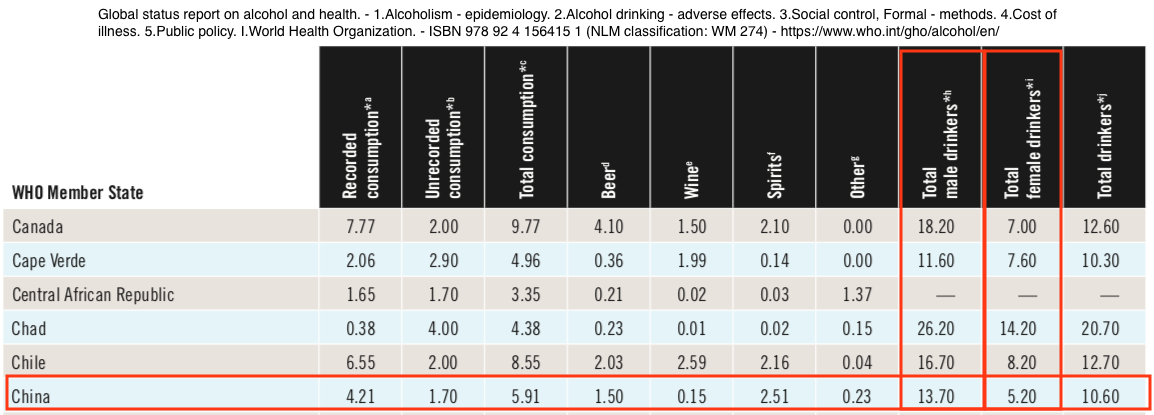
From: World Health Organization – Global Health Observatory (GHO) data (PDF) Report completed 2011 – Right-click table to view a larger image
Consumption data reflected in incorrect calculations for consumption categories
As part of the randomization process for Mendelian randomization, participants were randomly assigned to a calculated consumption level. This level was not on the basis of their own reported consumption. The assignment was on the basis of a calculation the investigators performed based on the region the participant came from combined with their genetic variation.
No thorough discussion or mathematical schema used in developing consumption category calculations were included in the paper.
In addition, the alcohol consumption categories were based on the Biobank baseline self-reported regional consumption data that — as indicated by WHO and other data — were significantly under-reported.
The Millwood investigators conducted the same protocols separately on men and women and have compared the male cohort outcomes to the females. Data indicate that the comparison is inappropriate.
Tobacco smoking not controlled
The study does not mention any procedure to try and reconcile the difference between men and women with regard to tobacco smoking. This excerpt from the study’s baseline data chart (below)

indicates a vast difference between men and women.
Not only is smoking recognized as a significant cause of cardiovascular disease, but acetaldelyde — the alcohol flush culprit — is also a major constituent of tobacco smoke. See also this link.
Women are not men
Women whose genotypes match those in the Millwood study react differently to alcohol.
This is illustrated by studies of diabetes which is, itself, a significant contributor to cardiovascular disease. One study of ALDH2 polymorphism and diabetes mellitus:
“[F]emale (but not male) workers with the ALDH2*1/1 genotype had significantly lower FPG [Fasting Plasma Glucose] levels than those with other genotypes, regardless of amounts of alcohol consumption
and
“ALDH2 mutant genotypes are both independent risk factors for T2DM in female CAD patients. But there was no obvious correlation between the ALDH2 genetic polymorphism and T2DM in male patients.”
Other studies — Pang, et al. (2017), as well as Baraona et al. (2006) have also noted gender differences in the effects of alcohol.
While the gender differences have not been as well studied, the evidence available this far casts further doubt on the use of the women’s study as a credible comparison.
Thus, the comparisons of relative male/female relative risks are questionable.
Results may not be applicable beyond Asian spirits consumption
Millwood et al. note that most alcohol consumption is in the form of spirits, and in the study’s brief discussions of limitations stated: “Since participants reported drinking mainly spirits, the effects of other drinks (e.g., red wine) could not be assessed.
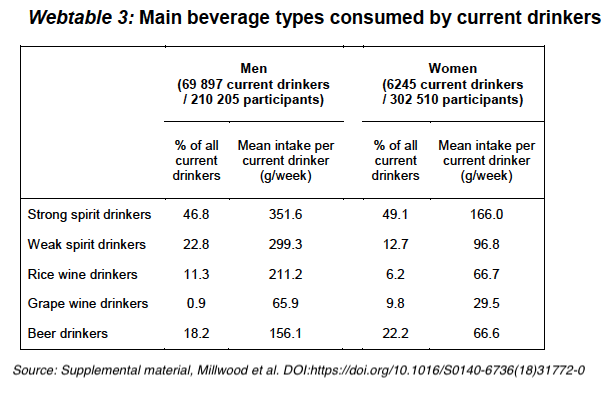 Rice wine typically has an alcohol by volume content of about 35%.
Formaldehyde and inherent acetaldehyde levels in Asian spirits may complicate health and genotypic interactions
Qian reports that: “Morbidity and mortality from poisoning with methanol and other contaminants [from illegally produced alcohol] are a major public health concern.”
In addition to possible bootleg production contaminants, Asian spirits contain the second highest levels of formaldehyde (and the highest over WHO limits) tested by Jendral et al. (2011).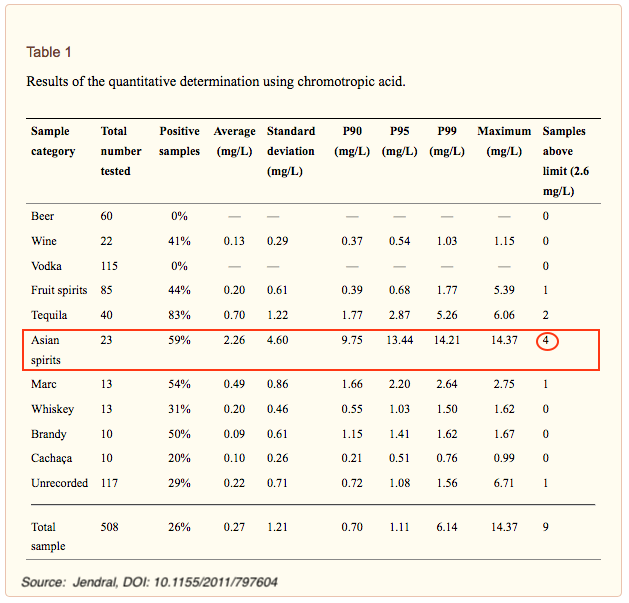
40% of alcohol consumption illegal and not reported
The WHO (relying on Qian) estimates that approximately 40% of all alcohol consumed in China is unreported — produced and consumed without being recorded by the government. This casts further doubt on the genotype-calculated alcohol consumption categories.
The usual problems that afflict conventional alcohol/health studies
The Millwood study also suffers from some of the persistent confounding factors that plague traditional epidemiological studies of alcohol and health.
- Memory recall issues.
- Alcohol content issues. The baseline survey asked for participants to estinate how many “drinks” they had. Few drinks in non-scientific settings are ever measured with precision.
- Most people do not have a clear idea of how much alcohol they are imbibing. Thus, any conversion of “drinks to alcohol content” as performed in this study are without any scientific basis.
- Social barriers may encourage under-reporting.
- Under-reporting could affect genotype-calculated categories
- Study self-selection bias
The plethora of methodological issues detailed, above, clearly raises concerns about the validity of the study’s conclusions.
Comments are closed.